






















Tables for Data & Project Management
Bring Excel into Confluence and turn your pages into live spreadsheets, with formulas, charts and tracking built in
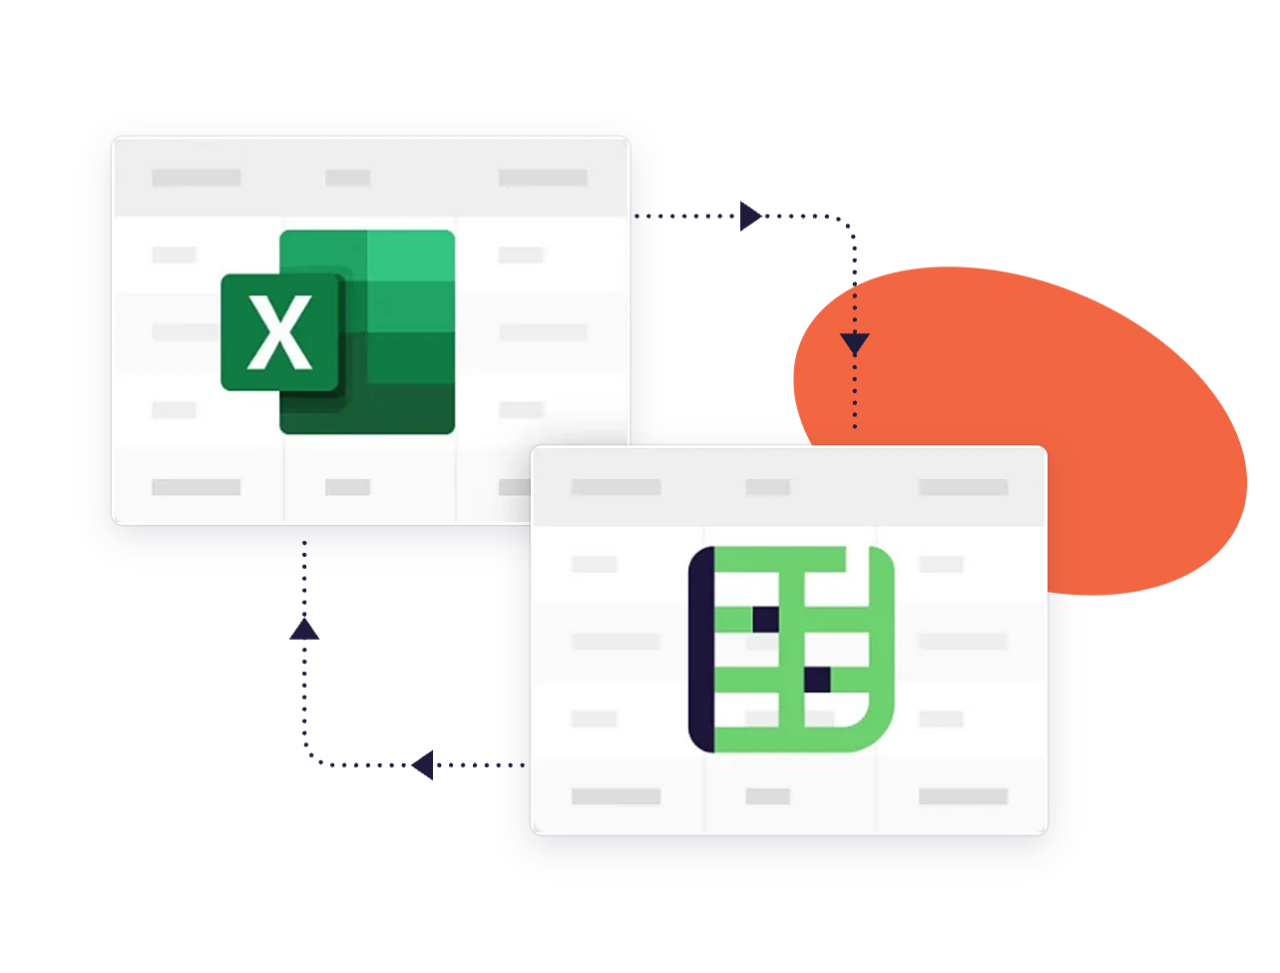
Import and export Excel to Confluence
Elements Spreadsheet brings your data and spreadsheets live on any page. Import and export your files while preserving their original formatting: no more copy-pasting, and the same Excel look and feel your teams already know.
Organize your data in Confluence has never been easier
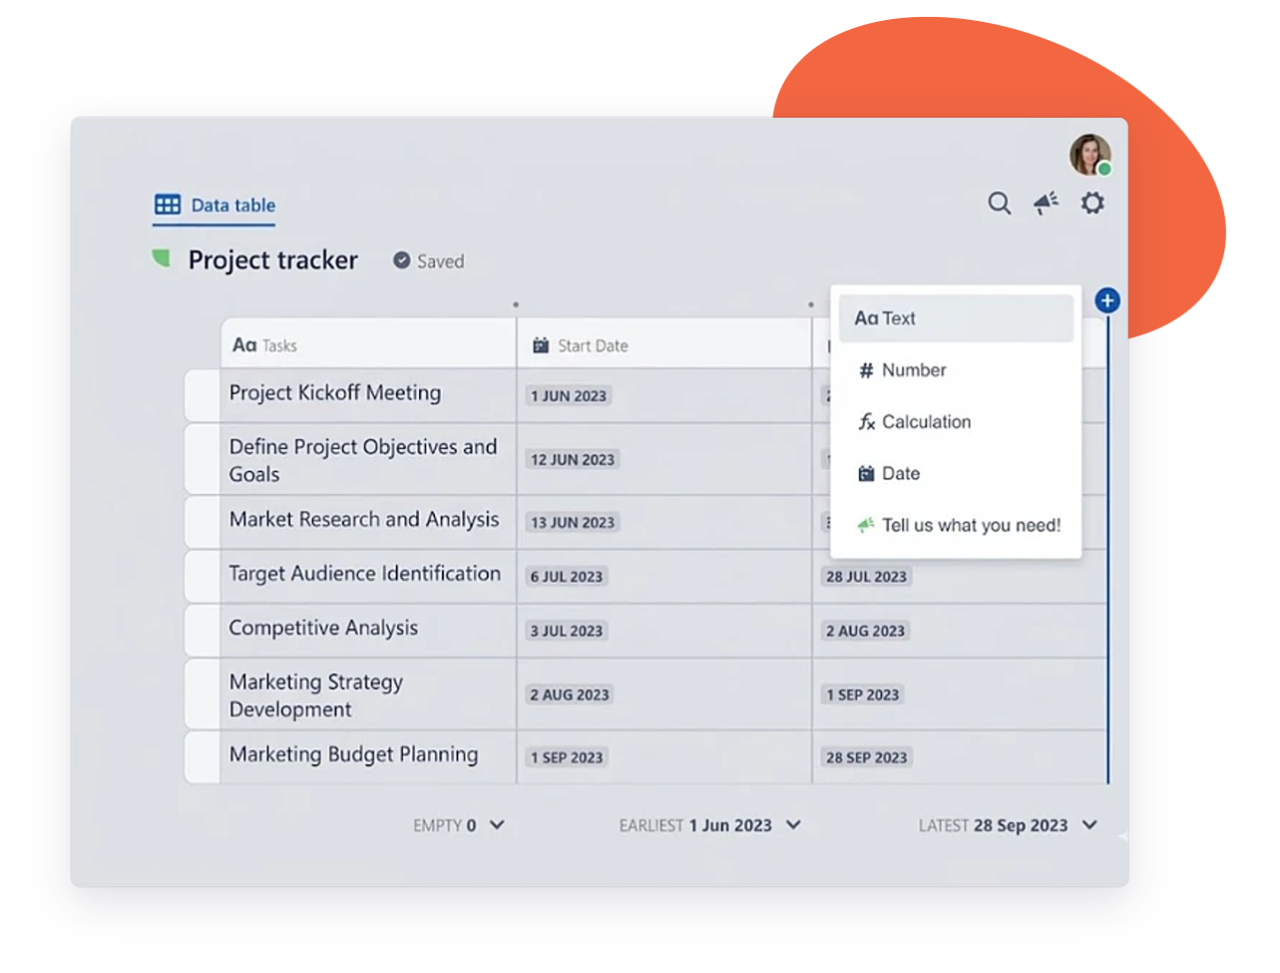
Optimize data organization with advanced formatting
– Pre-formatted & custom templates
– Formatting, filtering, sorting & data validation
– Specific data type (text, date, user)
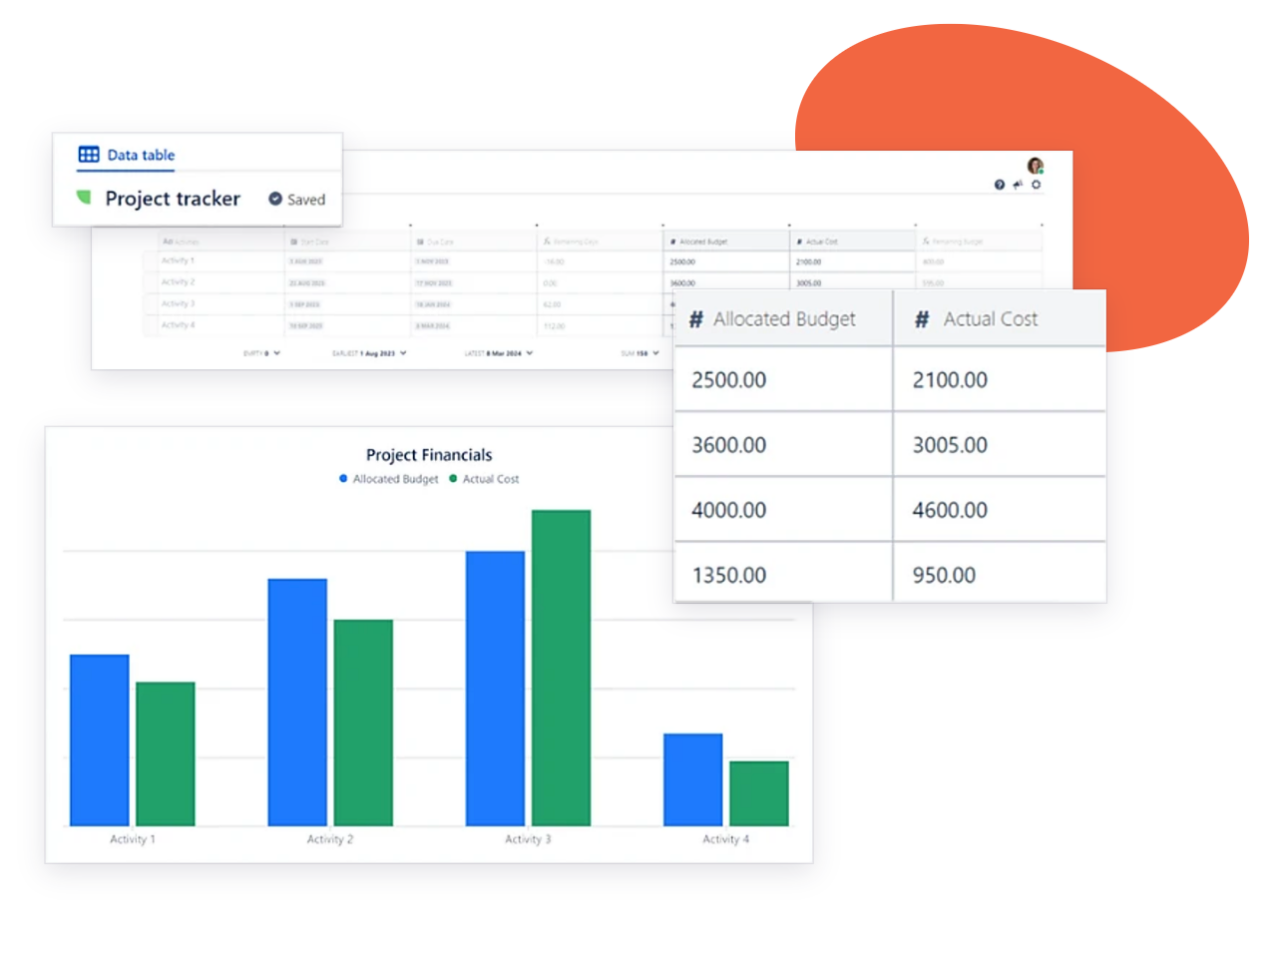
Turn complex data into actionable insights
Turn your spreadsheet data into Confluence’s native charts, right on the page. Visualize and analyze project information at a glance, and make informed decisions without exporting a single file.
Key benefits that keep work flowing
Keep numbers, decisions and documentation together, so teams report faster and work from data they trust
Data and context in one place
Tables sit next to the specs, meeting notes and decisions they support, so nobody has to hunt for the right file before a review.
Work together on live tables
Teammates update figures directly in the page where they’re discussed, instead of emailing attachments back and forth.
Fewer tools to manage
Tracking and reporting happen where your team already works, with no separate tool to license, share or keep in sync.
Consistent reporting across teams
Standardized tables make OKR reviews, budget follow-ups and campaign reports comparable from one space to the next.
A smooth move to Cloud
A documented Data Center to Cloud migration path brings your existing spreadsheets along, with data residency options to match your requirements.
Enterprise-grade security
SOC 2 Type II and ISO 27001 certified, and covered by the Marketplace Bug Bounty program.
Why teams choose Elements Spreadsheet
Built for every team that plans, reports and tracks work in Confluence

Track campaign performance in one page
Log spend, leads and conversions per channel next to the campaign brief, and update results as they come in. Formulas calculate cost per lead for you, and stakeholders always see the current numbers.

Run OKRs and budgets from shared templates
Set objectives, owners and key results in a standard table every team fills in the same way. Finance and HR can import their own company templates for budgets, headcount or expense tracking.
Manage your teams’ OKRs and budget
Import your company’s templates
Bring data into sprint retrospectives
Embed velocity, bug counts, or action items directly in the retro page, so the team discusses facts rather than impressions. Follow up on actions from one sprint to the next in the same table.
Keep trackers next to project docs
Move existing project plans and status trackers into the pages where the project lives. Filter by owner or due date to spot what’s at risk before the next status meeting.
Easily pull data from Excel into Confluence